Overview
This page provides you with the script for a Horseshoe Markov Random Field (HSMRF) skyline analysis on the left side. It is in addition to the Gaussian Markov Random Field Prior tutorial.
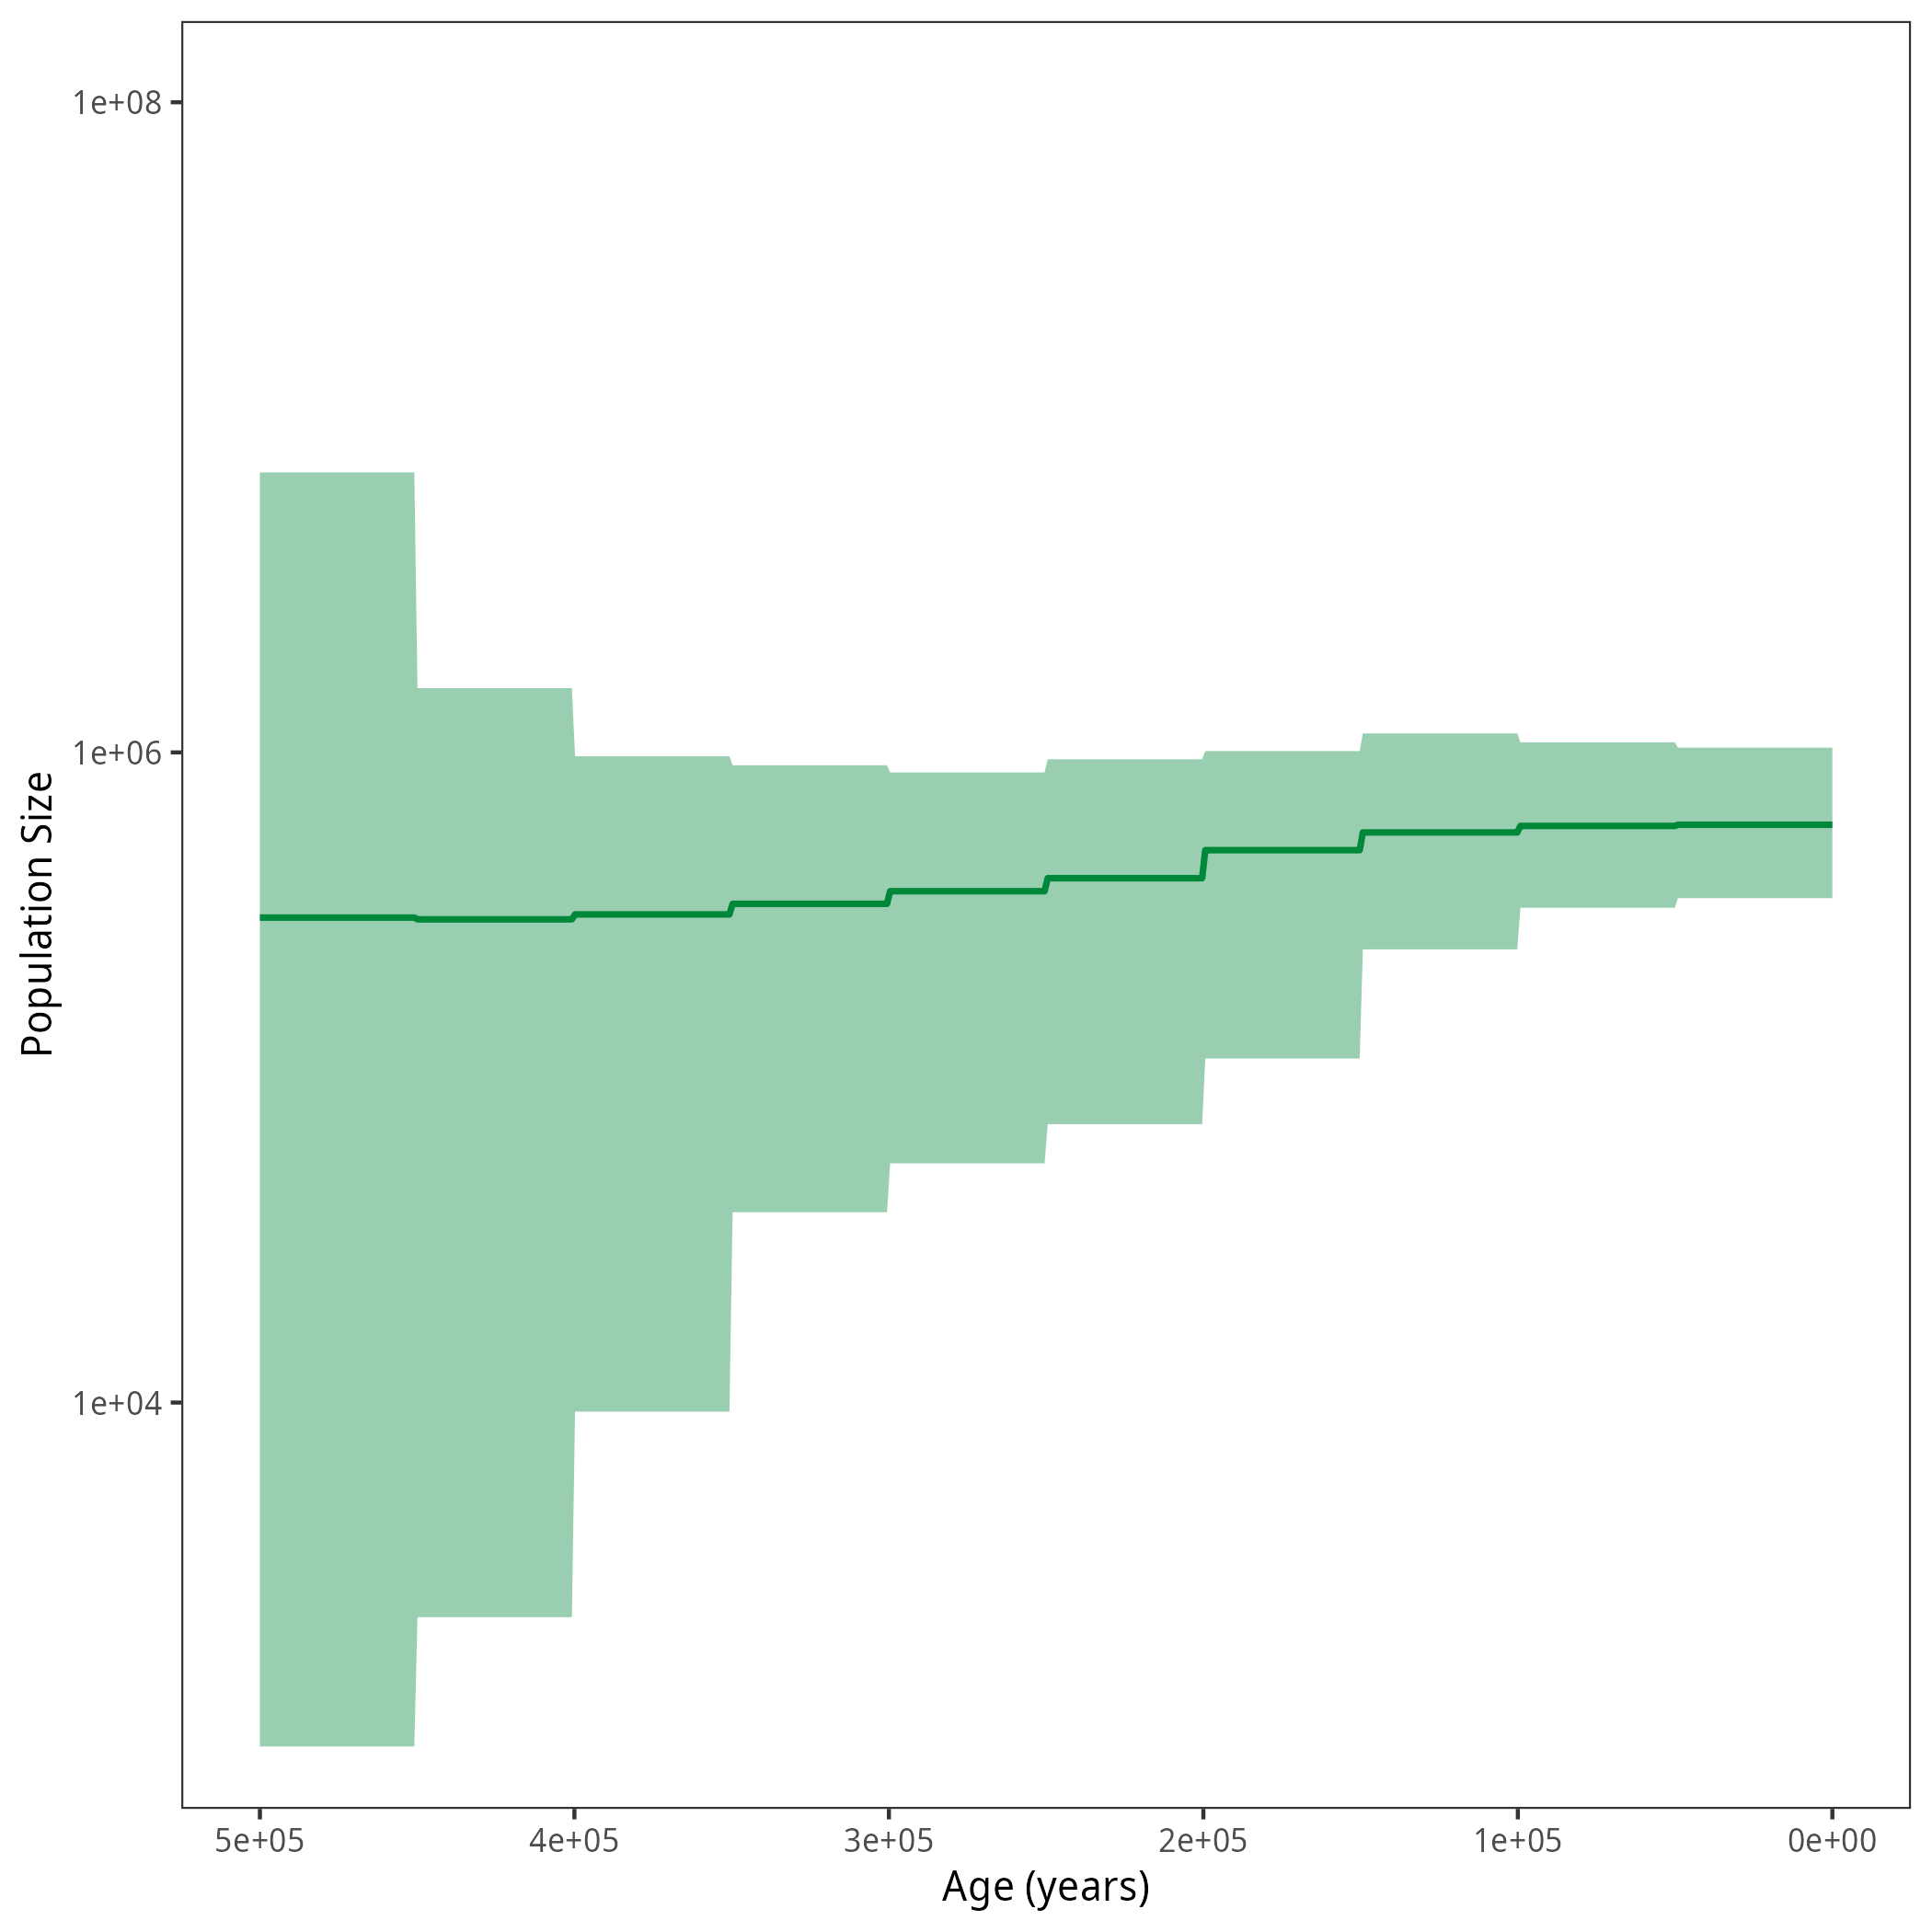
Results
After running your analysis, you can plot the results using the R package RevGadgets.